The meeting that priced nothing, and repriced everything ...
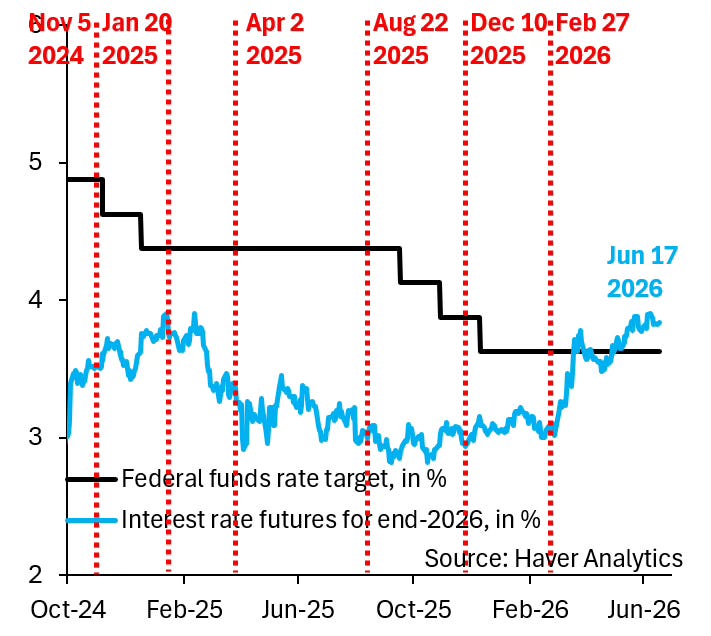
On 17 June 2026 the Federal Reserve left its target range unchanged at 3.50 to 3.75 percent. It was the first decision taken under a new chair, and the market had assigned the outcome a probability of 99.6 percent before anyone sat down. A decision that fully anticipated cannot move markets on the decision alone. The information was elsewhere, in the path. Over the preceding months the rates curve reversed its view of the next year, from an expected cut to an expected hike. This note reads that repricing as the market itself prices it: one scheduled meeting at a time.
Key takeaways
- The June decision was a non-event by design. Fed funds futures priced a hold at 99.6 percent, leaving a 0.4 percent chance of a hike and nothing for a cut. A meeting this fully anticipated moves on tone and forecasts, not on the rate.
- The real shift is in the projections. Three months earlier the median policymaker had pencilled in a quarter-point cut for 2026. The June projections reversed that to a quarter-point increase. The committee turned from an easing bias to a modest tightening one.
- A hike is now the base case by year end. At the December 2026 meeting the single most likely target range is 375 to 400, not the current 350 to 375. The probability of at least one hike by December is 58.7 percent, and of two or more, 16.5 percent.
- The peak is shallow and near. The probability-weighted path tops out around 3.9 percent in the first half of 2027 and then drifts sideways. This is a repricing toward one more hike, not the opening of a tightening cycle.
- The regime around the numbers changed too. The chair has been explicit that forward guidance is not a tool he intends to lean on. Less guidance forces the market to price the path from the data, which is precisely what these probabilities now do.
Where this departs from the easy read
The easy read: a held meeting, priced at 99.6 percent, is uneventful. Nothing happened, so there is nothing to do.
Our reading: the held meeting confirmed a turn that had already happened in the curve. The level did not move; the distribution of the next year did. Reading the level tells you nothing here. Reading the distribution tells you the whole story.
None of this requires a forecast of our own. The probabilities below are the market's, drawn from the same fed funds futures the whole desk watches. What a research note can add is discipline: to separate the decision from the information, to read the path rather than the print, and to state plainly what the curve is and is not saying.
A new chair, an unchanged rate
The June meeting was unusual for its chair, not its outcome. Kevin Warsh was sworn in as the seventeenth chair of the Federal Reserve on 22 May 2026, and 16 to 17 June was his first meeting presiding over the rate-setting committee. His predecessor, Jerome Powell, agreed to remain on the board after his term as chair ended, so the committee carries both men into the new regime. A leadership change at the top of a central bank is the kind of event that can unsettle a market. This one did not, because the decision had already been settled by the data.
Two terms, in one sentence each
- The target range is the band the Federal Reserve sets for the overnight rate at which banks lend to one another. In June it stood at 3.50 to 3.75 percent, a quarter-point band, and it was left there.
- The implied probability is the chance of each future rate, read from the price of fed funds futures. These are exchange-traded contracts that settle to the realised overnight rate, so their prices carry the market's collective bet on what the Fed will do.
With those two terms in hand, the meeting reduces to a simple question. The decision was a hold, and a hold was certain. So what, exactly, was the market uncertain about? The answer is not June at all. It is everything after June.
A 99.6 percent priced outcome is not a market holding its breath. It is a market that has already moved on. The committee inherited firm inflation and a labour market that has not cracked, a combination that argues for patience rather than either a cut or a hike at this particular meeting. The interest was always in how the balance of risk would be framed for the months ahead.
What June actually priced
The cleanest way to see how settled the decision was is to read the June meeting straight off the futures. The contract is the June fed funds future, which settles to the average overnight rate for the month. Its mid price of 96.3763 implies an average funds rate close to 3.6 percent, squarely inside the current band. With prior volume of 108,822 and open interest of 291,192 contracts, this is a deep and liquid market, not a thin quote that can be dismissed.
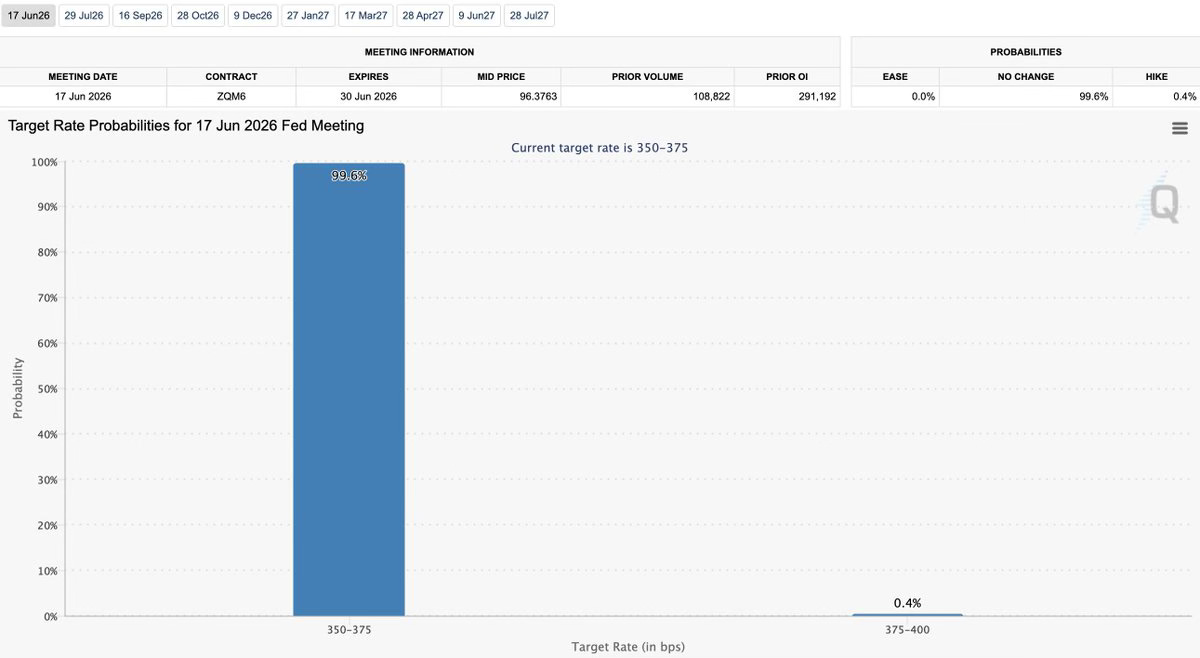
That last detail matters. In an easing cycle, the small residual probability sits on the cut side, as the market keeps a little weight on the Fed moving faster than expected. Here it sat on the hike side. Even at the meeting where nothing happened, the tail had already changed direction.
From a cut to a hike
The turn shows up first in the committee's own projections. In the forecasts released three months earlier, the median member expected to cut rates by a quarter point in 2026. In June that median flipped to a quarter-point increase. A committee does not reverse the direction of its own projection lightly; it does so when the data on inflation and growth have moved enough to change the balance of risk. The market, watching the same data, had already drawn the same conclusion, and it is visible across the whole strip of future meetings.
Read meeting by meeting, that same repricing has a precise shape.
That line is a summary. The detail behind it is the full grid of conditional probabilities, the market's odds for every target range at every scheduled meeting out to the end of 2027.
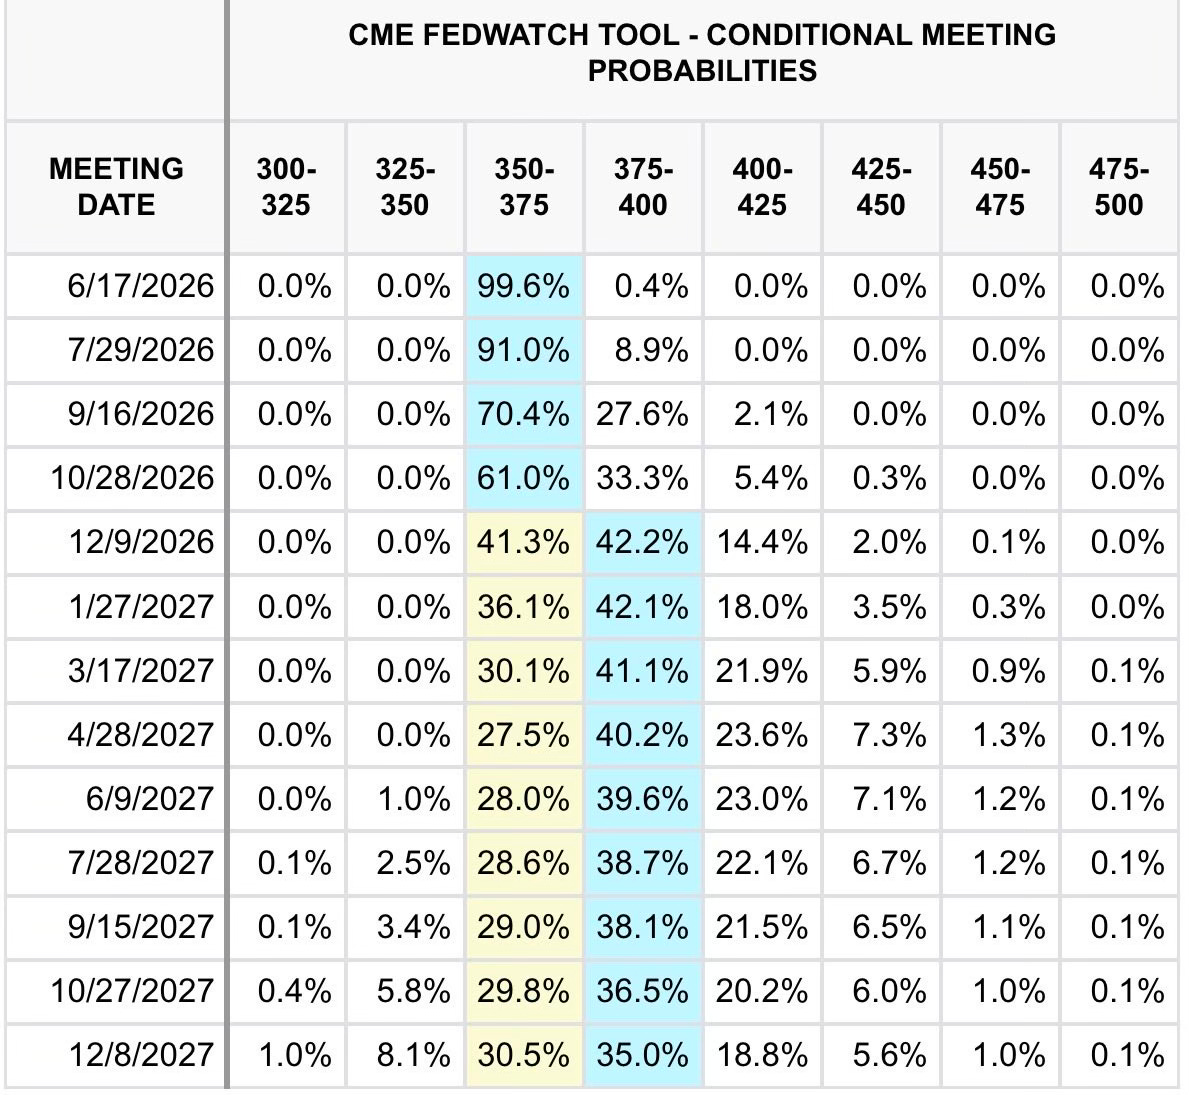
The highlighted column does one thing: at the 9 December 2026 meeting it steps up, from 350 to 375 across to 375 to 400, and it never steps back. From that meeting onward the market's single most likely outcome is a target range one quarter-point above today's. That is the precise moment the base case becomes a hike.
Sum the columns above today's range and you get the odds of having tightened at least once. By the December 2026 meeting that probability is 58.7 percent, more likely than not. The odds of two hikes or more are 16.5 percent, small but no longer negligible. The market is not pricing aggression. It is pricing the quiet removal of the last expected cut and the addition of one likely hike.
This is where the new chair re-enters the analysis, not as a personality but as a method. He has stated plainly that forward guidance is not the business the Fed should be in. A committee that guides less leaves the market to infer the path from incoming data rather than from spoken promises. The probabilities above are exactly that inference. In a guidance-light regime they become more important, not less, because they are the clearest read on a path the Fed has stopped narrating.
These are market-implied probabilities on a single date, and they move with every data print. A soft run of inflation or a weakening labour market would pull the highlighted column back toward a hold, or even reintroduce a cut the curve has currently priced out. The finding here is not a forecast of the funds rate. It is a faithful reading of what the curve priced on 17 June 2026, and a record against which the next prints can be judged.
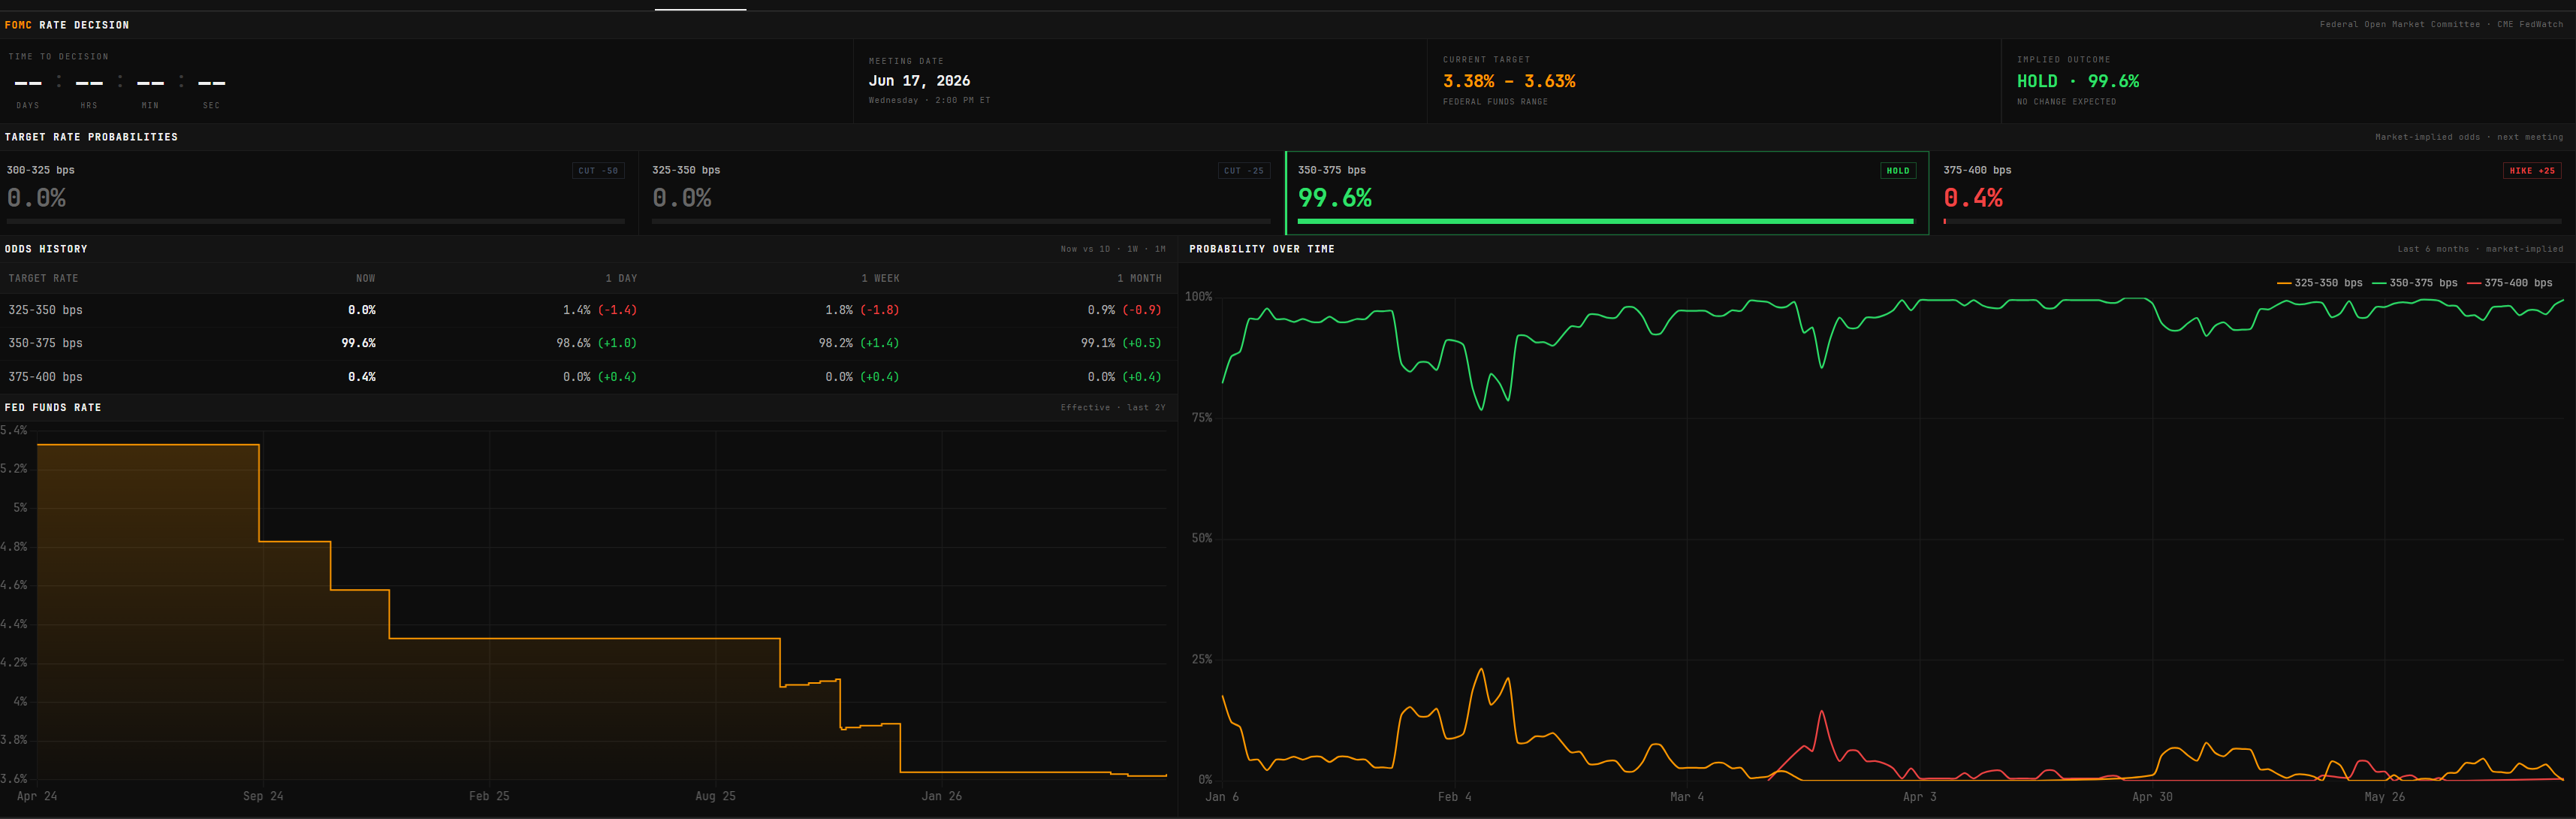
On the desk, all of this sits on a single screen.
What a higher path transmits
A path that drifts up rather than down has predictable mechanics elsewhere, before any view on a single asset is taken. A higher expected path of short rates tends to support the dollar, because it raises the return on holding it relative to other currencies. The same path is a headwind for assets that pay no yield, gold among them, because the opportunity cost of holding a non-yielding asset rises with the rate it could otherwise earn. None of this is a price call. It is the standard transmission, stated so the direction of the pressure is clear.
The asymmetry is the part worth holding onto. With the easing bias removed from both the statement and the projections, the larger surprise from here is a hawkish one. The market has already priced out the cut and priced in a likely hike, so a dovish turn would have to fight the data that produced the turn in the first place. The balance of risk, in the committee's language and in the curve, now leans the same way.
The rate decision was never the story. The story was a curve that turned from a cut to a hike while the headline stood still.
Read the distribution, not the print
The June meeting is a clean lesson in where information actually lives. The decision was certain and therefore empty. The value was in the shape of the curve behind it, which had reversed a year of easing expectations into a modest tightening bias without a single dramatic session. An investor who watched only the headline saw nothing happen. An investor who read the distribution saw the base case for the next year change.
- Separate the decision from the information. A 99.6 percent priced hold cannot move a market on the rate. When the decision is certain, the information is always in the path, never in the print.
- The path has turned. Median projections went from a quarter-point cut to a quarter-point hike for 2026, and the curve agrees: the modal outcome becomes a hike at the December 2026 meeting and stays there.
- Size the turn honestly. At least one hike by December is 58.7 percent, two or more is 16.5 percent, and the path peaks near 3.9 percent in 2027. This is one more hike priced in, not a cycle.
- Respect the new method. A guidance-light Fed makes the market-implied path the primary signal. The probabilities matter more precisely because the committee is saying less.
- Trade the distribution. The direction of the residual risk, the slope of the implied path, and the meeting where the mode flips are more useful than any single decision. Read the curve and let the headline pass.
This document has been prepared by Iron Hall Capital for informational and educational purposes. Its content does not constitute personalised investment advice, a recommendation to buy or sell financial instruments, a public offering, or a solicitation to subscribe to any financial product. The opinions and readings reflect Iron Hall Capital's judgement at the date of publication, are based on data considered reliable but not independently audited, and may be revised without notice.
Market-implied probabilities are derived from fed funds futures prices on a single date and change continuously as those prices move. They are an estimate of market expectations, not a forecast of the federal funds rate, and they may differ materially from the policy that is ultimately set. Past statistical relationships do not guarantee future results. Monetary policy decisions, macroeconomic data and central bank communication can move markets sharply and without warning. Before any decision, the reader should assess suitability to their own situation and consult professional advice where appropriate.
The author and Iron Hall Capital may hold, have held, or come to hold positions in the instruments referenced. Any reproduction, in whole or in part, requires written authorisation.
Iron Hall Capital · A private investment office · June 2026